Visualizing Mobile Broadband
Results from the FCC Speed Test
Skills used: HTML, CSS, jQuery, Jekyll, Mapbox.js
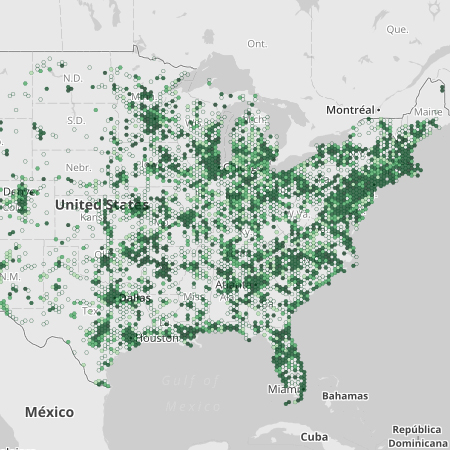
This visualization displays results from the FCC Speed Test app. This Android/iPhone app allows users to measure their mobile broadband performance and voluntarily report this data to the FCC.
Working with the FCC’s Chief and a great group of contractors I lead the design and front-end development of the Mobile Broadband visualization. The visualization is also mobile friendly.
With a large amount of data available we chose to provide a way for consumers to benefit from the speed test data by showing the download and upload speeds, along with latency and packet loss, for service providers within a geographic location.
Along with using the data from the speed test this project was build on Jekyll, the mobile broadband API, and Mapbox.js.